
Risk Characteristics (3 Year)
| FDAT | S&P500 | |
|---|---|---|
| STANDARD DEVIATION | -% | 12.57% |
| BETA | -% | 1.00 |
| MAX DRAWDOWN | -% | 18.76% |
Yields
| As of 12/31/2025 | |
| DISTRIBUTION RATE | 9.72% |
| 30-DAY SEC YIELD | 0.81% |
The SEC yield is generated from both income and short-term capital gains generated from the underlying investments of the fund. No portion of the distribution rate was categorized as return of capital, which is defined as the return of the investor’s initial investment.
Overview
Investment Approach
Tactical Advantage ETF (the "Fund") is an actively managed Fund that seeks to maximize long-term capital appreciation while limiting the impact of a market drawdown.
The Fund seeks to accomplish this dual mandate by identifying holdings showing the greatest upside potential. Then, during market drawdowns, the Tactical Advantage ETF reduces its exposure to underperforming holdings and, if necessary, increases its holdings of ultra-short US T-bills.
Fund Ideology
Fund Structure
The Tactical Advantage ETF is actively managed using a “fund-of ETFs” structure which allows FDAT stay diversified without the inherent risk that comes with owning individual stocks.
When fully invested, FDAT will hold ETFs from a cross section of the US economy and will be comprised of U.S. equity, U.S. bonds and U.S. preferred stocks.
FDAT will hold money market funds or an ultra-short-term T-bills ETF during times of market distress.

Actively Managed

Priority on Minimizing Volatility

High Income Potential
Distributes income resulting from capturing
profitable trades.

Diversified Portfolio of US Companies
Fund Details
As of 04/08/2026TICKER
NET ASSETS
34,892,287.12
CUSIP
ISIN
PRIMARY EXCHANGE
INCEPTION DATE
FDAT NAV
21.67
FDAT MKT
21.71
SHARES OUTSTANDING
1,610,000
PREMIUM/DISCOUNT
0.19
CLOSING PRICE
21.71
Median 30-Day Spread Percentage
0.32
EXPENSE RATIO
SUB-ADVISOR
FUND DISTRIBUTOR
Performance
Performance data quoted represents past performance; past performance does not guarantee future results. The investment return and the principal value of an investment will fluctuate so that an investor’s shares, when redeemed, may be worth more or less than their original cost. The current performance of the fund may be lower or higher than the performance quoted. Performance data current to the most recent month end may be obtained by visiting www.tacticaladvantageetf.com or by calling (833) 817-7010.
Short-term performance, in particular, is not a good indication of the fund’s future performance, and an investment should not be made based solely on returns. Market Price: The current price at which shares are bought and sold. Market returns are based upon the last trade price. NAV: The dollar value of a single share, based on the value of the underlying assets of the fund minus its liabilities, divided by the number of shares outstanding. Calculated at the end of each business day.
Holdings
Historical Premium/Discount
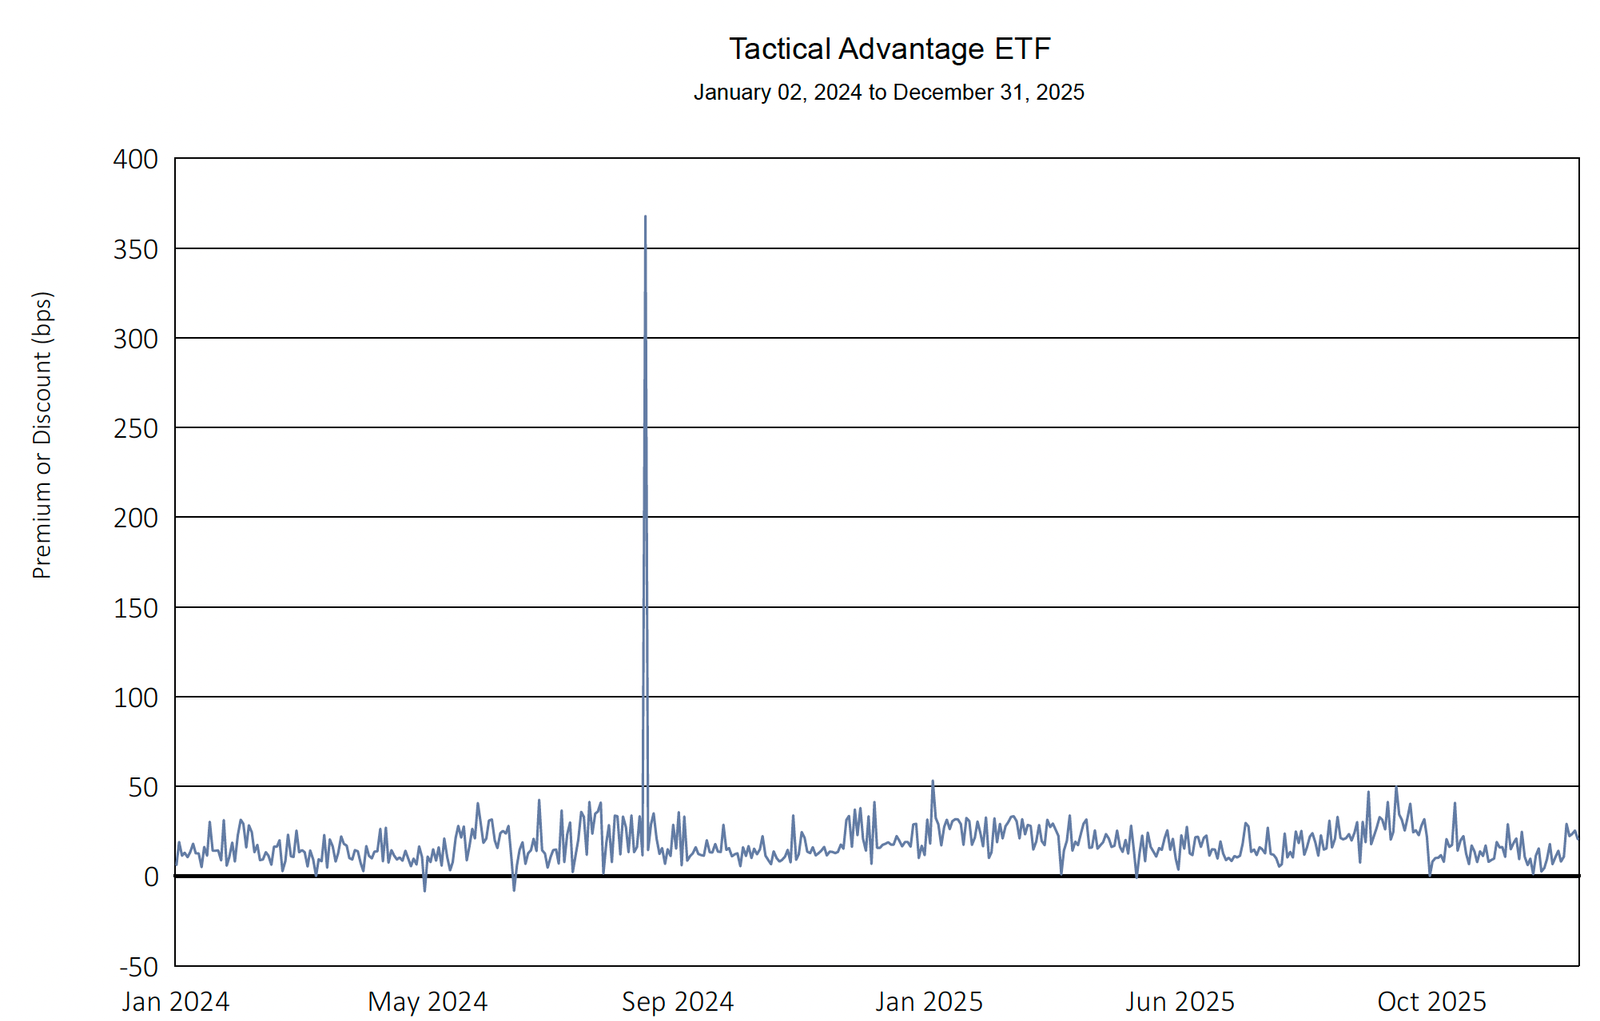
| 2024 | Q1 2025 | Q2 2025 | Q3 2025 | Q4 2025 | |
|---|---|---|---|---|---|
| Days traded at premium | 250 | 61 | 61 | 64 | 64 |
| Days traded at net asset value | 0 | 0 | 0 | 0 | 0 |
| Days traded at discount | 2 | 0 | 1 | 0 | 0 |
The following table and line graph are provided to show the frequency at which the closing price of the Fund was at a premium (above) or discount (below) to the Fund’s daily net asset value (“NAV”). The table and line graph represent past performance and cannot be used to predict future results. Shareholders may pay more than NAV when buying Fund shares and receive less than NAV when those shares are sold because shares are bought and sold at current market prices.
